#data-visualisation-1
Read more stories on Hashnode
Articles with this tag
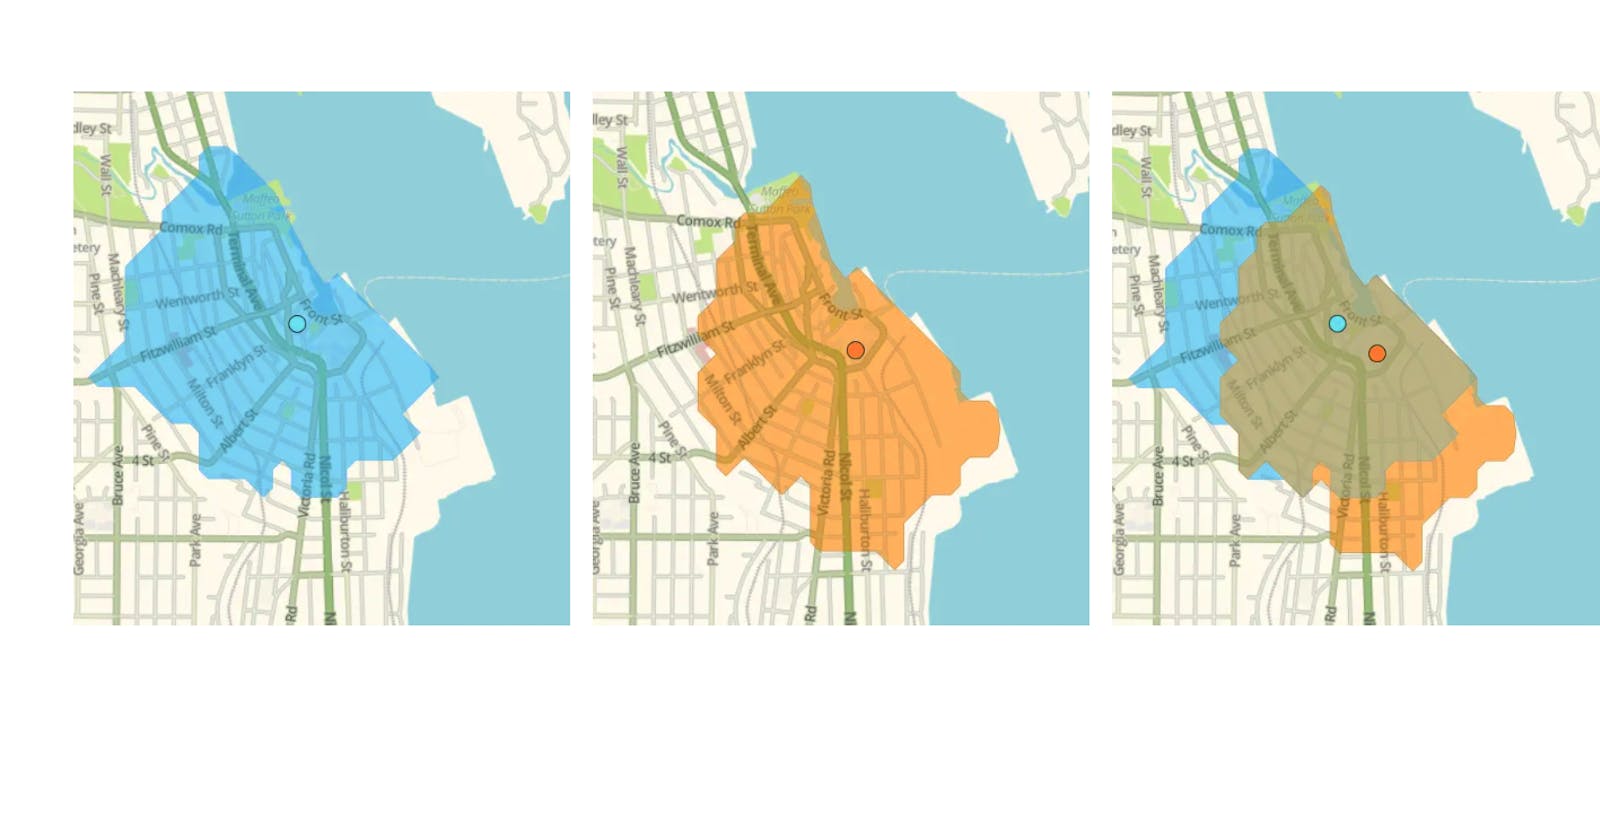
Find out how extracting quantitative data from Google Maps can help us understand and suggest improvements in the urban environment. · What makes a city...
So you've extracted data from the website, now what? What about a little data visualization experiment, the one involving an early morning bicycle...